![]()
 |
|
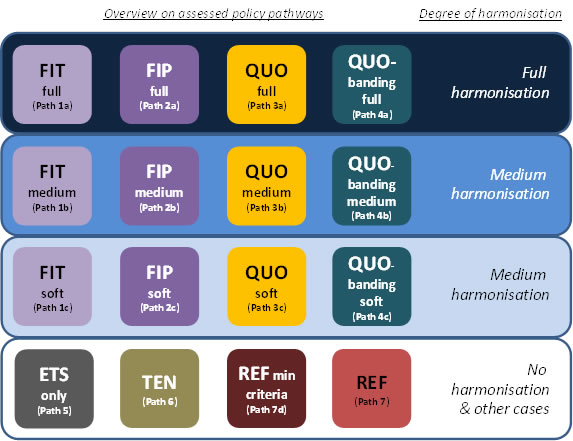 |
Four policy instruments (i.e. feed-in tariffs, feed-in premiums, uniform quotas and quotas with technology banding) stood in focus of the policy assessment, combined with varying degrees of harmonisation (i.e. full, medium and soft) resulted in 12 different policy cases.
Additional pathways included:
- Tendering for selected RES-E technologies: A pathway of using EU-wide tenders to support selected RES-E technologies (i.e. wind and centralised solar (PV and CSP) while support for the remainder of technology options falls under the sovereignty of MSs (path 6), and
- ETS only / no dedicated RES support (path 5): Under this option, no binding RES targets would exist for 2030. Instead, the ETS represents the key driver at EU level for the deployment of low carbon technologies in the period beyond 2020, under which two variants are considered: a scenario of “low carbon prices” corresponding to the Commission’s policy option of a “business as usual” development; and a case of “moderate to high carbon prices”, reflecting a decarbonisation without dedicated RES targets post-2020.
- Reference cases with (path 7d) or without (path 7) minimum design criteria: Both pathways build on the assumption that the current policy framework as given by the RES Directive (2009/28/EC) will be prolonged for the period up to 2030, meaning (inter alia) that national RES targets for 2030 will be established. Similar assumptions are consequently made for RES support – i.e. a continuation of strengthened national RES policies until 2030. Differences are, however, assumed with respect to the EU-wide prescription of minimum design criteria (i.e. with or without minimum harmonisation) and the level of cooperation (i.e. strong or limited), respectively.
Note that, generally, a suitable mixture of support instruments is also envisaged for RES in heating & cooling. Thereby, a similar conceptual approach is taken to that discussed for RES electricity, where support instruments are either (fully or partly) harmonised or tailored to country-specific needs. In contrast to this, for biofuels in transport physical trade across the EU is assumed, meaning that support follows current practices.
Below a brief list of other key assumptions taken and general remarks is provided:
- This policy assessment complements and partly updates the previous related modelling activities – e.g. the quantitative assessment of RES policy options as conducted within the IEE project futures-e (see e.g. Resch et al., 2009) in the 2020 context, or the European Commission’s “Energy Roadmap 2050” (European Commission, 2011) containing PRIMES modelling of feasible energy pathways for achieving long-term carbon commitments.
- In order to assure consistency with other related studies at EU level, the key assumptions on the conventional reference system, energy and carbon prices as well as energy demand were based on these general energy scenarios, in particular on the PRIMES “high renewables” case.
- Similar to this PRIMES case, the targeted deployment for RES (as share in gross final energy consumptions) at EU level by 2030 was set at 31.2% 1 for all Green-X scenarios 2.
- For the period up to and by 2020, the assumption was taken that national RES targets as defined by the RES Directive (2009/28/EC) would be met. Consequently, a strengthening of national RES policies combined with a mitigation of non-economic barriers was assumed to take place in the near future, i.e. from 2015 onwards. The resulting 2020 RES deployment served as a common starting point for all assessed policy pathways beyond 2020.
Key results on RES-E deployment and related support expenditures
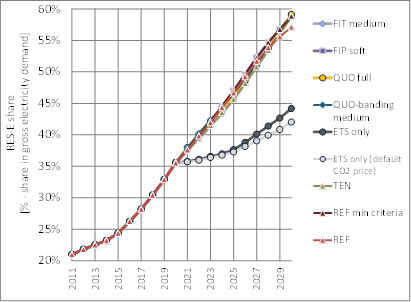
Next, only a brief overview of the results gained within the final assessment is given, indicating the key outcomes for RES policy assessment, using the example of the EU level for the electricity sector only: see Figure 2 and Figure 3 .
More precisely, Figure 2 illustrates for a selection of policy pathways 3 the feasible RES-E deployment over time (left) as well as by 2030 (right), indicating the penetration of new RES-E installations within the observed time frame. It becomes evident that, without dedicated support, RES-E deployment would stagnate after 2020, reaching a share of RES-E of 42.0% by 2030 4. This indicates that an ETS by itself does not provide sufficient stimulus for RES-E deployment. In contrast to the “no support” case, within all other policy variants the expected deployment of RES in the electricity sector by 2030 ranges from 57.1% to 59.2%. If total RES deployment is taken into consideration, “no (dedicated RES) support” would lead to a RES share in gross final energy demand of 21.2% 5 by 2030, while in all other policy paths it appears feasible to reach the targeted RES share of 31.2% by 2030.
 |
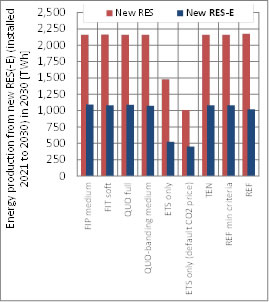 |
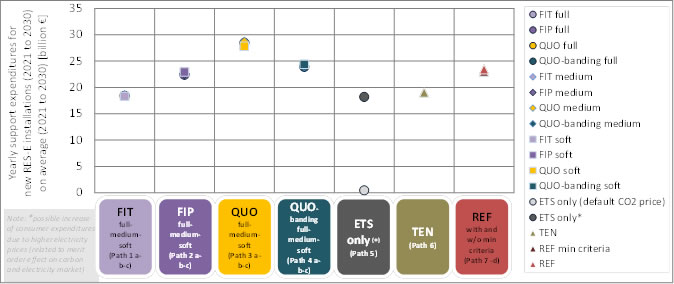
Figure 3 complements this depiction, indicating – in addition to RES-E deployment – the cost impact, in particular the resulting support expenditures for new RES-E installations. More precisely, Figure 3 offers a comparison of both overall deployment of new RES-E plants (installed between 2021 and 2030) by 2030 and the corresponding support expenditures (on average per year for the period 2021 to 2030) for the selected policy pathways. Apparently, soft harmonisation a via feed-in premium system, strengthened national RES policies complemented by strong cooperation and coordination (prescribing minimum design criteria) or medium harmonisation in the case of quotas with technology banding appear suitable to keep RES well on track to reach moderate-to-ambitious deployment targets for 2030. Related support expenditures can then be maintained on a comparatively low level (at € 22.9 to € 24.1 billion as a yearly average for new RES-E installations), while the uniform RES support involved in the case of a harmonised RES trading regime (without banding) may lead to a significant increase of the consumer burden (to € 28.5 billion). Best performers in terms of cost-effectiveness among the basket of selected policy pathways are the system of fixed feed-in tariffs under medium harmonisation and a variant of the reference case of strengthened national policies (with minimum design criteria) where EU-wide tenders are used for wind (on- and offshore) and centralised solar systems (large-scale PV and CSP) – i.e. under these cases yearly average (2021-2030) support expenditures for new RES installations in the forthcoming decade reach the comparatively lowest levels (€ 18.5 to 19.0 billion €).
In the case of “no (dedicated RES) support”, obviously no support expenditures for RES are applicable. If long-term climate targets are taken seriously, meaning that Europe strives for the 80%-95% GHG reduction by 2050, no dedicated RES support may, however, possibly cause the following effects. A comparison of the two variants of “no support”, characterised by either low (in the case of no strong carbon commitment) or moderate-to-high carbon prices (reflecting a strong long-term carbon commitment: i.e. an 80%-95% GHG emission reduction by 2050), indicates that, in the absence of a strong RES deployment, a rise in electricity prices may lead to an indirect consumer burden of almost similar magnitude to that involved in the case of perfectly-tailored RES policies. In the absence of continuous RES support and related expansion, this is caused, on the one hand, by a reduction of the so-called “merit order” effect that usually goes hand in hand with RES deployment. On the other hand, a lower RES-E penetration leads to higher carbon prices and, thus, also higher electricity prices, since more alternatives have to enter the (common) carbon market in order to comply with the carbon target 6 7.
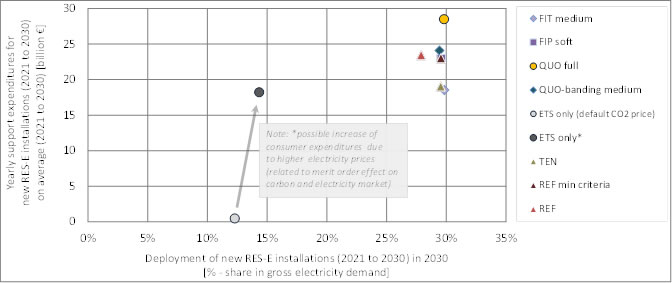 |
How does the degree of harmonisation affect the economic performance of policy instruments? A first indication of the impact arising from that is provided next. Figure 4 compares yearly average (2021 to 2030) support expenditures for new RES-E (installed 2021 to 2030) for all assessed policy pathways. Remarkably, the type of instruments chosen plays a more prominent role than the degree of harmonisation. Only small differences are applicable among the variants by type of instruments. For example the cost-effectiveness of a feed-in premium system appears nearly unaffected by the degree of harmonisation: only a negligible difference between the resulting support expenditures under full, medium or soft harmonisation can be observed, i.e. expenditures range from € 22.6 to € 22.9 billion. Although almost negligible, uniform quotas show a better performance under soft harmonisation, where harmonised uniform support is complemented by (limited) national incentives, aiming to steer parts of the investments towards those regions where required to meet given national 2030 RES targets. In contrast to above, feed-in premiums and banded quotas show a better performance in the case of full harmonisation, and, finally, a fixed feed-in tariff system appears generally unaffected by the degree of harmonisation.
 |
Key findings of the quantitative RES policy assessment
The current RES Directive (Directive 2009/28/EC) lays the basis for the EU’s RES policy framework until 2020, but a strategy and clear commitment to RES beyond 2020 is needed (if RES are to deliver what is expected). The results of the model-based policy assessment indicate that cooperation and coordination among Member States (e.g. through a prescription of minimum design criteria) appear beneficial and, indeed, are required to tackle current problems in RES markets. Thus, such an approach would also appear to be fruitful for the period beyond 2020. It also appears promising to complement national support activities by an EU-wide harmonised scheme offering support for selected key technologies like wind and centralised solar.
In terms of cost-effectiveness best performer is a harmonised fixed feed-in tariff system, offering safe and secure revenue streams for investors. Other candidates for a soft, medium or full harmonisation are feed-in premiums and quotas with technology banding. By contrast, “simplistic approaches” to RES policy harmonization (e.g. via a uniform RES certificate trading) cannot be recommended – neither in the short nor in the long term (compare also Resch et al., 2010). Moreover, the model-based assessment clearly points out that the degree of harmonisation has only a small impact on the performance of an instrument – i.e. differences between a soft, medium or full harmonisation appear generally negligible.
_____________________________________________________________________________________
1 According to the European Commission’s Energy Roadmap 2050 (European Commission, 2011) the assumed 2030 RES target can be classified as “ambitious”, reflecting a decarbonisation pathway for Europe where RES are expected to become the major contributor.
2 In the Green-X scenario of “no (dedicated RES) support”, no RES target was assumed for 2030 since under this policy variant deployment represents only an outcome but not a precondition.
3 In order to increase the readability for each type of assessed support instrument only one representative is chosen for these depictions – i.e. for a feed-in tariff system its performance in the case of a medium harmonisation is shown while for uniform quotas the variant referring to full harmonisation is illustrated.
4 This figure refers to the variant of low carbon prices. If moderate-to-high carbon prices are assumed, a RES-E share of 44.2% can be reached.
5 Again, this figure refers to the case of low carbon prices. Note that in the case of moderate / high carbon prices a RES share of 26.3% appears feasible.
6 Note however, that both the merit order effect on electricity and CO2 price are distributional effect between consumers and producers. These effects cause consumer profits on the one hand and losses for (conventional) producers. Therefore the benefit discussed above only exists from the consumers’ point of view.
7 Complementary to RES several options exist to mitigate GHG emissions, including supply-side options such as nuclear power, carbon capture and sequestration of thermal (fossil and biomass) power plants and an increase in energy efficiency both at the supply (i.e. increased conversion efficiencies of thermal power generation units and/CHP) and at the demand side (i.e. a more efficient use of energy and/or a reduced demand for energy services). All these options may benefit due to an increase of their competitiveness in the case of high(er) energy and/or carbon prices.